Analyzing Goal Difference Distributions for K League 1 After Round 14
With the 2022 K league 1 season reaching Round 14 last weekend, there is enough data to start looking more accurately at the state of each side. With this, statistician and Café Tactiques founder and writer Ben Griffis analysed the goal difference distributions for top-flight sides so far in this campaign.
Now that the 2022 season is really in swing, we have enough data to look at each K League 1 team’s distribution of their matches’ goal differences.
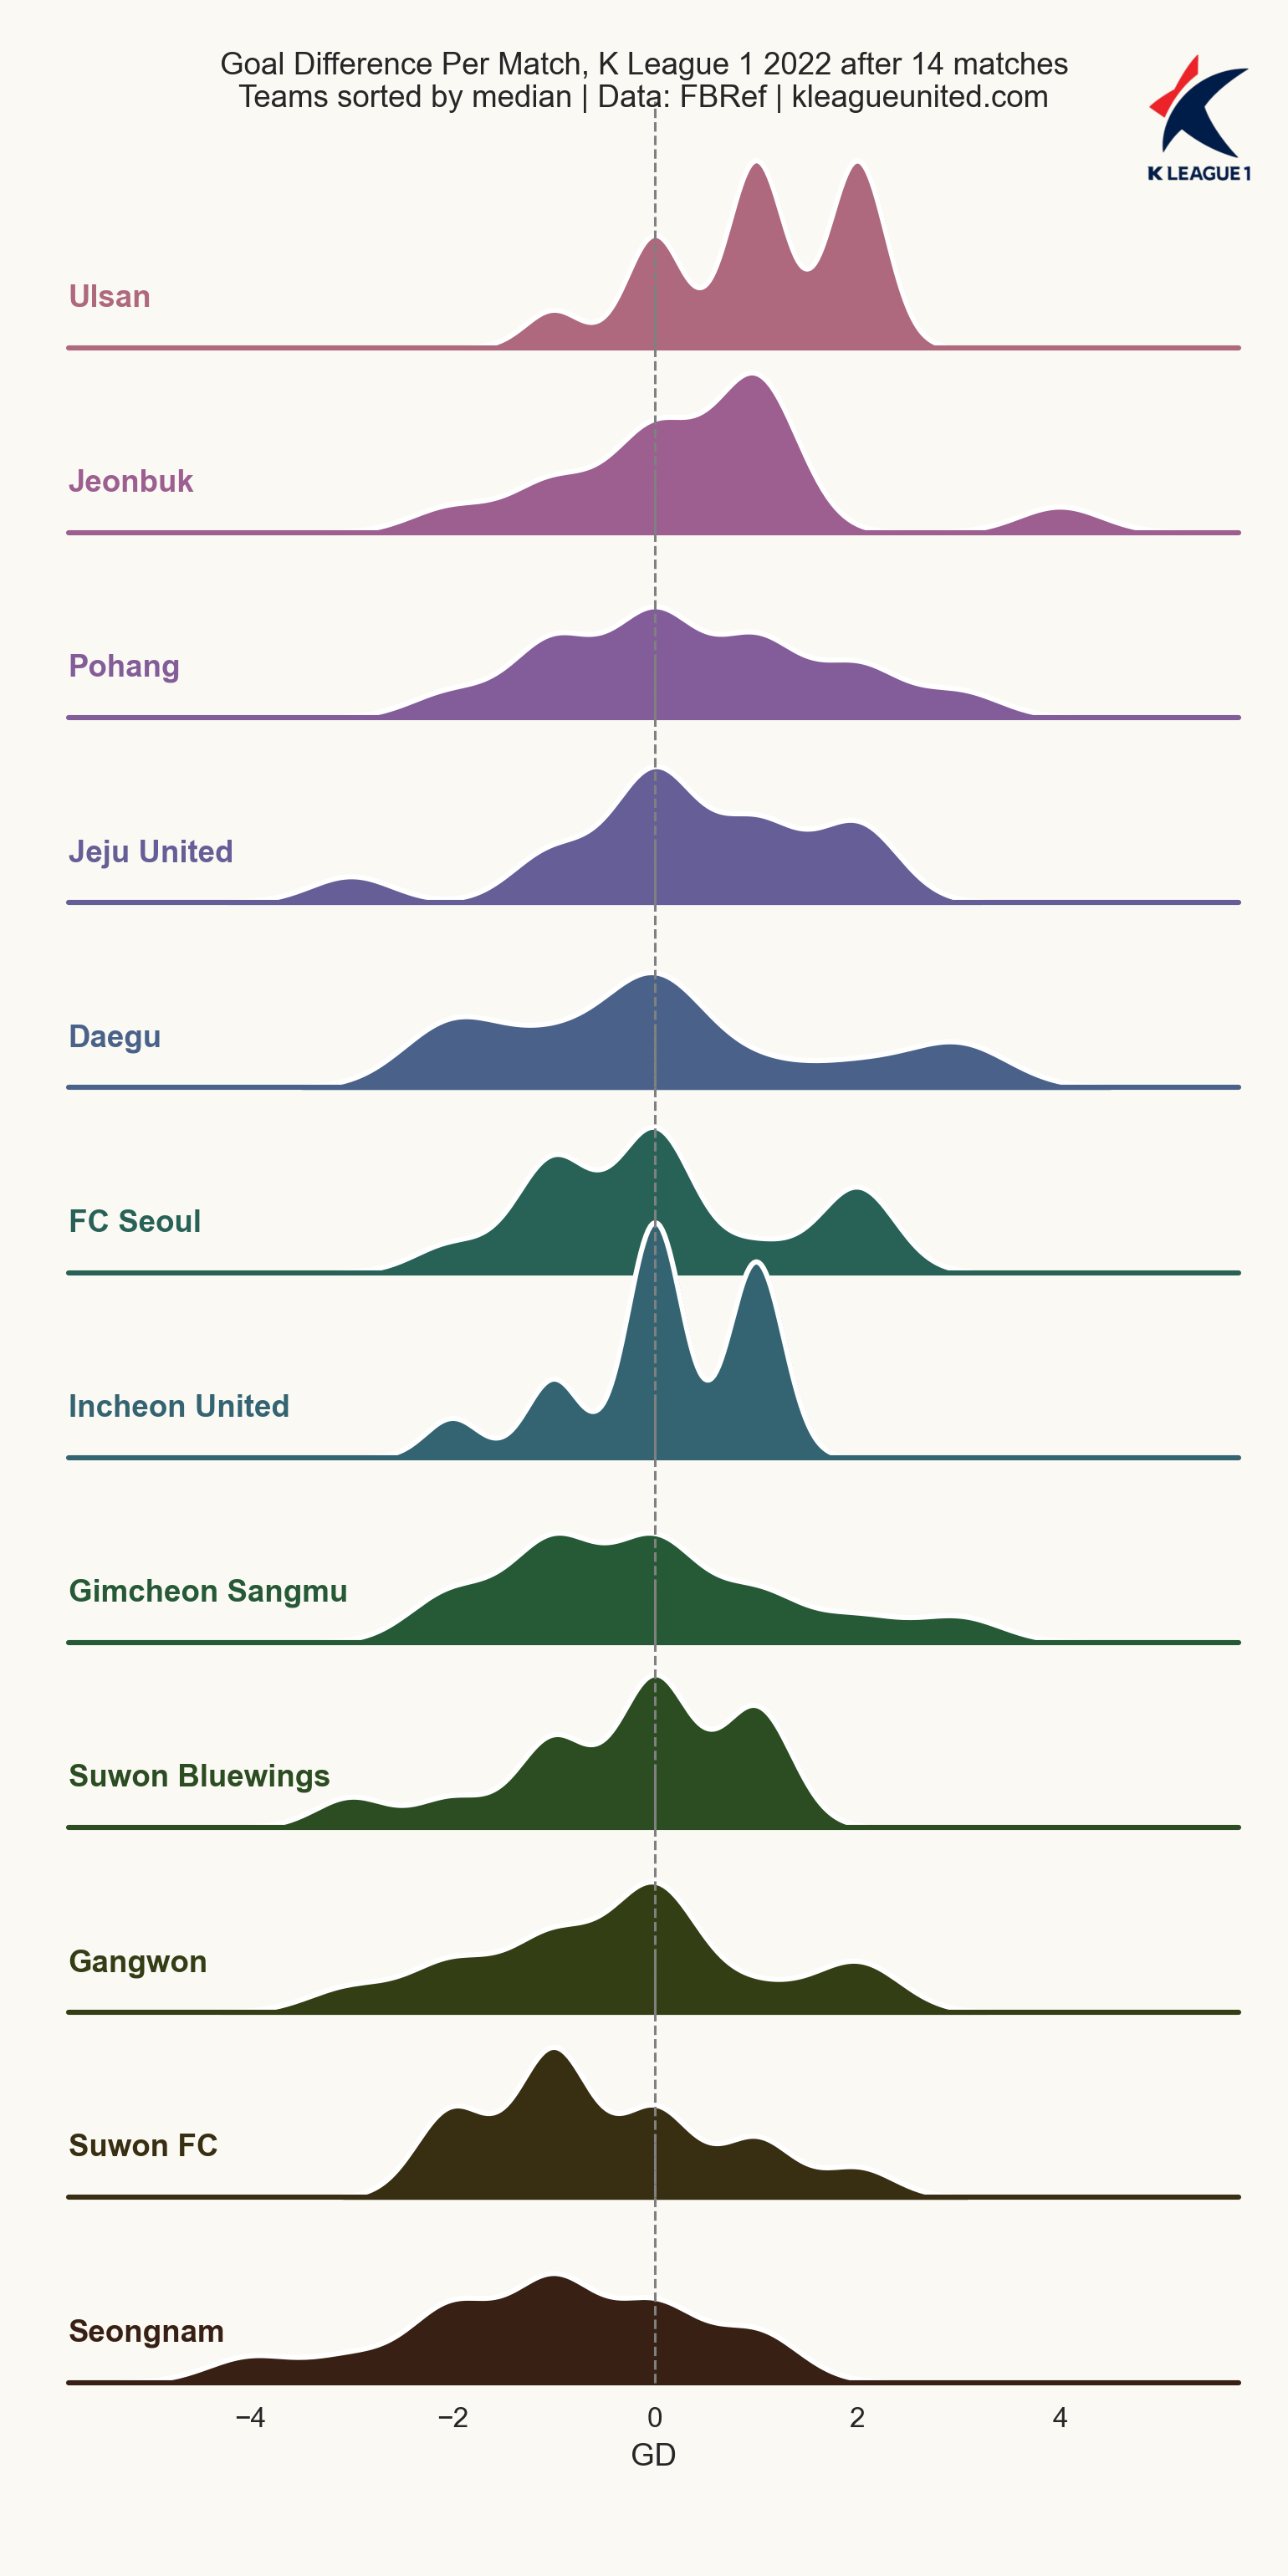
This chart shows each team’s distribution of their goal differences (GD) in each of their 14 matches. GD is the goals for minus goals against, so this graph gives an indication of each team's average quality. The teams are sorted, top to bottom, by their median GD. The median is the middle number of all 14 matches’ GD, so it acts as an average but is not skewed high or low based on a single or a couple of extreme results. Where multiple teams have the same median, the team with the higher simple average GD would be ahead of the one with a lower average.
We can see some individual matches in this chart; the small ridge on the right of Jeonbuk’s chart shows their 0-4 win at Seongnam on matchday 9. Similarly, Jeju United’s 3-0 opening day loss to Pohang is the ridge on the left of their chart. Finally, the higher the ridge, the more matches that team has had for that goal difference (such as Incheon having most their matches ending in draws, GD = 0, or one-goal victories, GD = +1).
Overall, this chart shows teams in a similar position to their league position—which is expected, as typically teams who perform worse in matches will have worse goal differences than others ahead of them.
However, Incheon United are below both Daegu and FC Seoul, who are four points below Incheon in the table. Despite having 21 points, Incheon have the most draws in the league (six) and all five of their wins are by a single goal. Interestingly, until their 0-2 loss to Pohang on recent matchday 14, both of their losses were by a single goal as well.
We could interpret this by saying that even though Incheon have four more points than Daegu and FC Seoul, their results are much more fragile than Daegu or FC Seoul’s. A couple late slips and those wins become draws, draws become defeats, and Daegu or FC Seoul can easily pass Incheon on the table.
Unsurprisingly, Ulsan are handily at the top of this chart while Seongnam are at the bottom. Ulsan have been the best team of the early stages of this 2022 edition, with half of their wins being by two goals. Seongnam, on the other hand, have had over half of their losses being by at least two goals (5 of their 9). Both of Seongnam’s wins have been by a single goal, despite them putting four past fellow bottom-table side Suwon FC.
We can also compare 2022’s chart to 2021’s chart, using just the first 14 matches for each team last season. The writing on the wall doesn’t look great for Seongnam, as last season’s 12th-placed Gwangju FC weren’t even at the bottom of the GD distribution chart. However, there is always time to turn results around, so Seongnam will need to string results together soon.
In a different tone, Incheon United have improved dramatically on their early season form from last season. Even though this season’s results may be quite fragile, they were dead-last in last season’s chart after 14 matches with very inconsistent results, ranging from a 5-goal loss to a 3-goal win and everything in between. It’s better to have consistency and mainly draws and losses than inconsistency with the possibility of conceding five goals.
Overall, these charts reflect the league tables at the time but can add an extra layer of information to a team’s consistency or possible fragility. Comparing a focal team’s distribution to the surrounding teams on the table can give insight into the level of difficulty to catch teams above or be caught by teams below them on the table. And at least for this season, it appears as though Incheon United may be vulnerable, given their slim margins on average.


![[about]](https://blogger.googleusercontent.com/img/b/R29vZ2xl/AVvXsEh0mXcKy7h0fXIgdvWFm5DpFfwXkPr2ggzUt9_AoPo8vS0HOsFMT8KsO21qTLZBKoLyQXSOAckzy4OtJCPOoHtL5cGqAa0zXKzIdiW45D6TCFAisfJUODssBTfrkat95GXhJc8haWSP3nyV/s1600/KLU.png)
No comments:
Post a Comment